Bar Charts
Related Worksheets
Updated 18/11/17
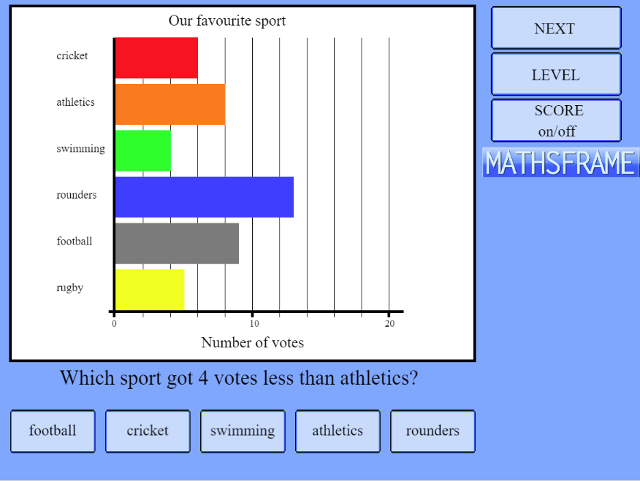
A new and improved bar charts game. This version uses both vertical and horzontal bars and has a wider range of one step and two step questions. This game is tablet friendly and will work on any device.

Scan to open this game on a mobile device. Right-click to copy and paste it onto a homework sheet.
Game Objectives
New Maths Curriculum:
Year 3: Interpret and present data using bar charts, pictograms and tables
Year 4: Interpret and present discrete data using bar charts and continuous data using line graphs
KS2 Primary Framework:
Year 5: Interpret a reading that lies between two unnumbered divisions on a scale