ITP Data Handling
Related Worksheets
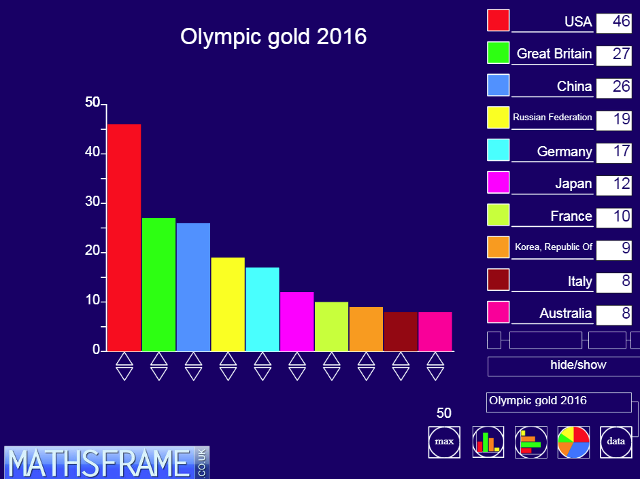
I am remaking the ITPs so that they will work on all modern browsers and tablets. They will remain freely available to all without the need for a subscription. This ITP allows you to enter data into a table and then create a vertical bar chart, a horizontal bar chart or a pie chart. You can select from existing data sets, which you can amend to show the impact and change on the charts, or enter data the children collect.
Parts of the table can be hidden so that you can ask questions about the data, for example, hiding the data values so pupils are to read the values from the graph. The height of the bars in the bar chart can be increased or decreased using the pointers at the base of each bar. This will also change the values in the table and where appropriate adjust the scale.


Game Objectives
New Maths Curriculum:
Year 3: Interpret and present data using bar charts, pictograms and tables
Year 4: Interpret and present discrete data using bar charts and continuous data using line graphs
Year 5: Solve comparison, sum and difference problems using information presented in line graphs
Year 6: Interpret and construct pie charts and line graphs and use these to solve problems
KS2 Primary Framework:
Year 5: Interpret a reading that lies between two unnumbered divisions on a scale

